Powered by Unipro Tech
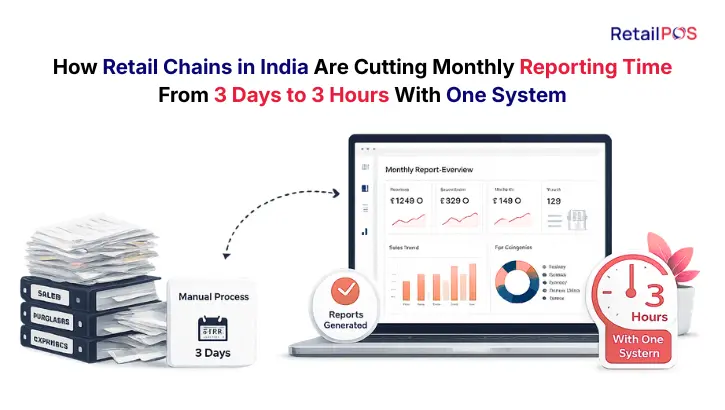
How Retail Chains in India Are Cutting Monthly Reporting Time From 3 Days to 3 Hours With One System
1. Introduction
Every retail chain owner in India knows this feeling. The month closes. The first week of the new month begins. And somewhere in the business, usually in the accounts room or in a shared WhatsApp thread between store managers and the head office team, a slow and painful process begins.
Someone starts collecting sales data from each outlet. Someone else is chasing the purchase team for supplier invoices. The warehouse manager is counting stock and sending numbers on WhatsApp. The accounts team is opening five different Excel files, copying columns from one into another, cross-referencing figures that do not quite match, and building the monthly report that the owner needs to understand how the business performed last month.
By the time this report reaches the owner, it is three days into the new month. The data it contains is already stale. The decisions it informs are already behind the operational reality. And the team that produced it has spent three full days on a task that contributed zero value to any customer interaction, any purchasing decision, or any revenue-generating activity in the business.
This is the monthly reporting reality for the majority of Indian retail chains that are managing multiple outlets on disconnected systems. And it is entirely unnecessary.
Retail chains that have implemented unified retail management platforms are producing the same reports, with greater accuracy and more analytical depth, in under three hours. The difference is not the quality of the team. It is the architecture of the system.
This guide explains exactly why manual reporting takes three days, what it actually costs, what three-hour reporting looks like in practice, and how Indian retail chains of every size and category are making the transition.
2. Why Monthly Reporting Takes 3 Days in Most Indian Retail Chains
To understand how to fix the reporting problem, it is important to understand precisely why it takes as long as it does. The three-day cycle is not the result of inefficiency or laziness. It is the logical outcome of a system architecture that was never designed for consolidated multi-outlet reporting.
Each Outlet Is an Island of Data
In a retail chain where each outlet runs its own billing system without a central backend, every outlet’s data is trapped in that outlet’s local system. To build a consolidated report, someone must physically access each outlet’s system, run an export, and transfer the data to the person building the report. For a chain with six outlets across different parts of a city, this data collection exercise alone takes half a day even when every outlet responds promptly.
When outlets are slow to respond, when exports fail, or when one outlet’s system is down for maintenance, the data collection phase extends further. The entire report is blocked until every outlet’s data is available because a consolidated report with missing outlet data is worse than no report at all.
Data From Different Systems Does Not Align Automatically
When billing data arrives from multiple outlets, it rarely aligns without manual intervention. Outlet 3 uses a slightly different product naming convention than Outlet 1. Outlet 5 has categorised a product under a different department heading than the others. The date format in Outlet 2’s export is different from the format in Outlet 4’s. Before any meaningful analysis can begin, the raw data must be cleaned, standardised, and reformatted into a consistent structure.
This data cleaning phase is invisible work that consumes significant time but produces no analytical insight. It is pure overhead created by the absence of a unified data standard across the chain.
Purchase, Inventory, and Sales Data Come From Different Sources
A meaningful monthly report for a retail chain does not only need sales data. It needs sales data alongside purchase data to calculate gross margin. It needs stock data alongside sales data to calculate inventory turnover. It needs staff data alongside revenue data to calculate labour cost as a percentage of revenue. It needs GST data alongside billing data to verify compliance accuracy.
In a disconnected system environment, each of these data types comes from a different source. Sales from the billing system. Purchases from Tally or a manual register. Stock from a warehouse count conducted once a month. Staff data from an attendance register or a separate HR tool. Bringing all of these sources together into a single report requires a person who understands each source, can translate between them, and has the time to do it carefully enough to avoid errors.
Errors Require Rework That Adds Days
When the consolidated data does not reconcile correctly, which it rarely does on the first attempt in a manual process, the team must trace the discrepancy back through every data source to find the error. A closing stock figure that does not match the opening stock plus purchases minus sales requires investigation across the billing system, the purchase records, and the warehouse count. Each investigation loop adds hours or days to the reporting cycle.
3. The Real Cost of 3-Day Reporting Cycles for Indian Retail Chains
Most retail chain owners think of the three-day reporting cycle as an inconvenience. The actual cost is significantly higher than inconvenience.
Direct Labour Cost
Calculate the total staff hours consumed by the monthly reporting cycle across your entire chain. Include the store managers who compile and send outlet-level data, the accounts team who consolidates and builds the report, the warehouse team who performs the stock count, and the owner or senior manager who reviews and queries the report. For a chain with five outlets, this total typically exceeds 40 person-hours per month. Multiply by 12 months and the annual labour cost of manual reporting is substantial.
Decision Delay Cost
The most financially significant cost of three-day reporting is not the labour. It is the decisions that are delayed or made incorrectly because the information arrives too late or is not accurate enough to trust completely.
A purchasing decision made on a report that is three days old is a purchasing decision made without knowledge of the last three days of sales. In a fast-moving retail environment where a product can go from adequate stock to stockout in 48 hours, three-day-old data is dangerously outdated for operational decision-making.
A promotional strategy decided on the basis of last month’s category performance report may be miscalibrated if the report’s category attribution was manually applied and contains errors. An outlet that appears underperforming in a manually compiled report may be performing normally when the data is correctly attributed.
Management Capacity Cost
The owner or senior manager who spends time reviewing, querying, and discussing a manually compiled monthly report is spending management capacity on historical data review rather than forward-looking strategy. When reports are late, managers spend their most productive hours of the early month in report review rather than in planning and decision-making for the month ahead.
Cost Category | 5-Outlet Chain Monthly Impact | Annual Impact |
Direct labour hours for data collection | 15 to 20 hours across all outlets | 180 to 240 hours per year |
Accounts team consolidation time | 12 to 18 hours per month | 144 to 216 hours per year |
Warehouse stock count for reporting | 8 to 12 hours per month | 96 to 144 hours per year |
Owner review and query resolution | 4 to 6 hours per month | 48 to 72 hours per year |
Total across chain | 39 to 56 hours per month | 468 to 672 hours per year |
Decisions delayed by 3 days | Every operational decision | Compounded strategic cost annually |
4. What Reports Indian Retail Chain Owners Actually Need Every Month
Before examining how unified systems produce reports faster, it is useful to map exactly which reports a retail chain owner in India needs and why each one matters for the business.
Sales Performance Report
This is the foundational report that every retail chain owner needs. It shows total revenue for the period broken down by outlet, by product category, by day of week, and by time of day. It shows which outlets are growing, which are declining, and which are flat. It shows seasonal patterns and promotional impact. Without this report in accurate, timely form, the owner is flying blind on the most basic question of how much the business sold and where.
Gross Margin Report
Revenue tells you how much you sold. Gross margin tells you how much you kept after paying for what you sold. A gross margin report breaks down the percentage margin by outlet, by category, and by product. It shows whether your most popular products are also your most profitable ones and identifies the Plowhorse products that sell well but generate thin margins that are diluting your overall profitability.
Inventory and Stock Movement Report
This report shows opening stock, purchases received, sales deducted, adjustments made, and closing stock for every product across every outlet. It is the foundation for identifying shrinkage, calculating inventory turnover, and understanding which products are moving fast and which are sitting. For retail chains managing thousands of SKUs across multiple locations, this report is operationally critical and also the hardest to produce manually because it requires data from the most sources.
Purchase and Vendor Performance Report
This report shows what was purchased during the period, from which suppliers, at what prices, compared to contracted rates. It shows supplier delivery performance, price variance from standard costs, and the relationship between what was purchased and what was sold to identify over-buying and under-buying patterns. For retail chains spending significant amounts on inventory procurement every month, this report directly informs negotiation leverage and purchasing strategy.
GST Compliance Summary
This is not just an accounts team report. It is a management report that shows the total GST liability generated during the period, the ITC available to offset it, the net liability payable, and the compliance status of the return filings. For retail chain owners who have experienced GST scrutiny notices, this report is as important as the sales performance report.
Staff Productivity Report
This report shows revenue per staff hour, transactions per cashier, average transaction time, and labour cost as a percentage of revenue by outlet. It is the report that allows owners to identify which outlets are over-staffed relative to their revenue and which are under-staffed in ways that are affecting service quality.
Customer and Loyalty Report
This report shows new customer acquisition during the period, repeat purchase rate, average transaction value by customer segment, loyalty point issuance and redemption, and campaign performance if SMS or WhatsApp campaigns were run during the period. For retail chains with active loyalty programmes, this report directly informs customer retention strategy.
5. How Disconnected Systems Create the Reporting Problem
The reporting problem in Indian retail chains is a systems architecture problem, not a people problem. It is worth being precise about this because many retail chain owners invest in better staff or better reporting processes when the root cause is the system design.
In a disconnected multi-outlet environment, data is created in multiple places and stored separately. The billing system at each outlet creates sales data. The accounting system creates financial data. The warehouse creates inventory data. The purchase team creates procurement data. None of these systems are aware of each other. They each hold a partial picture of the business and no single system holds the complete picture.
Building a monthly report in this environment means assembling a puzzle where each piece comes from a different box. The pieces do not naturally fit together. They must be manually trimmed, adjusted, and aligned before they form a coherent picture. And by the time they do, the picture they show is already historical.
The unified retail management system solves this at the architectural level. Every data-creating event in the business, every sale, every purchase receipt, every stock adjustment, every staff clock-in, every loyalty transaction, writes to the same central database. The reporting system draws from one source. There is no collection exercise because the data is already there. There is no cleaning exercise because the data was entered to a consistent standard at the point of creation. There is no reconciliation exercise because there is only one version of every number.
6. What 3-Hour Reporting Looks Like in a Unified Retail Management System
Here is a precise description of what the monthly reporting cycle looks like for a retail chain operating on a unified management platform.
On the first day of the new month, the owner or finance manager opens the reporting module. They select the previous month as the reporting period. The system immediately displays a complete dashboard showing consolidated revenue across all outlets, gross margin by category, stock position at every outlet, purchase total and vendor-wise breakdown, GST liability summary, staff productivity metrics, and customer acquisition and retention data.
This initial dashboard takes approximately 15 minutes to review. The owner identifies three areas that need deeper investigation: one outlet whose revenue declined compared to the prior month, one product category where gross margin compressed, and one supplier whose invoices show a price variance above the standard cost.
For each of these three areas, the owner drills down into the relevant sub-report. The outlet revenue decline investigation takes 20 minutes and reveals that a competitor opened nearby during the month, which explains the revenue pattern. The gross margin compression in one category traces to a supplier price increase that was not reflected in the menu cost update. The supplier price variance report shows the exact invoices where above-standard pricing was charged.
Total time for the complete monthly review: 2 hours and 45 minutes. Every finding is based on accurate, complete data that reflects every transaction across every outlet during the period. No data collection. No manual consolidation. No reconciliation. No rework.
7. Report by Report: Manual vs Automated Comparison
Report Type | Manual Process Time | Automated Process Time | Key Difference |
Sales performance consolidated | 4 to 6 hours | 2 minutes | No data collection or consolidation required |
Gross margin by category | 3 to 5 hours | 5 minutes | Recipe cost linked to billing data automatically |
Inventory and stock movement | 6 to 10 hours | 3 minutes | Every movement tracked in real time from one system |
Purchase and vendor performance | 2 to 4 hours | 3 minutes | Purchase data in same system as sales data |
GST compliance summary | 4 to 8 hours | 5 minutes | All transaction GST data already categorised |
Staff productivity report | 2 to 3 hours | 2 minutes | Shift data and revenue data in same system |
Customer and loyalty report | 1 to 2 hours | 2 minutes | All loyalty transactions in central CRM |
Outlet vs outlet comparison | 1 to 2 hours | Instant | All outlet data in one database |
Total monthly reporting cycle | 23 to 40 hours | 22 to 30 minutes active time | Remainder is review, not production |
8. How Multi-City Retail Chains in India Handle Consolidated Reporting
For retail chains operating across multiple cities, the reporting challenge is even more acute than for single-city chains. A retail chain with outlets in Hyderabad, Chennai, and Bengaluru must collect and consolidate data across three cities, potentially three GSTINs, and possibly different product mixes and pricing structures for each market.
In a disconnected system environment, multi-city reporting is often so painful that many retail chains simply stop trying to produce genuinely consolidated reports and instead review each city’s performance separately. This means the owner never gets a true picture of how the business is performing as a whole and cannot make genuinely informed decisions about where to invest, where to cut, and where the greatest growth opportunities exist.
A unified retail management platform with multi-outlet cloud architecture eliminates this problem entirely. The Hyderabad outlet’s transactions and the Chennai outlet’s transactions and the Bengaluru outlet’s transactions all write to the same central database in real time. A consolidated report covering all three cities is no more technically complex than a report covering a single outlet. The system produces it from the same data source with the same query. The only difference is the geographic scope.
For retail chains that operate under separate GSTINs in different states, the reporting system can produce both consolidated business performance reports and separate GSTIN-wise compliance reports from the same underlying data. The owner gets the business picture. The accounts team gets the compliance picture. Both come from one source in minutes rather than days.
Consider a textile retail chain with outlets in Banjara Hills in Hyderabad, Koramangala in Bengaluru, and Anna Nagar in Chennai. The owner wants to know which city’s market generates the highest gross margin on the same product category. In a disconnected system, answering this question requires three separate data pulls, manual standardisation, and careful comparison. In a unified system, this comparison is a single report filter applied to the central database. The answer appears in seconds.
9. The Management Decisions That Change When Reporting Becomes Real-Time
The transition from three-day reporting to real-time reporting does not just save time. It fundamentally changes the quality and speed of management decisions across the retail chain.
Purchasing Decisions Become Proactive Instead of Reactive
When stock movement data is available in real time, purchasing decisions are made before stockouts happen rather than after. A fast-moving product that is trending toward stockout in three days is visible on today’s dashboard. The purchase order goes in today. The product arrives before the shelf goes empty. In a manual reporting environment, this information would have appeared in the monthly report three weeks after the stockout already happened.
Promotional Decisions Are Based on Current Data
A promotional campaign decision made on last month’s sales data may be miscalibrated for this month’s market conditions. A promotional decision made on real-time sales velocity data reflects what is actually happening in the stores right now. The promotion amplifies what is already working rather than trying to revive what was working a month ago.
Underperforming Outlets Are Identified and Addressed Faster
When outlet performance data is consolidated and visible in real time, an underperforming outlet is identified within days rather than weeks. The owner can investigate, understand the cause, and implement a correction while the situation is still recoverable. In a three-day reporting environment, a declining outlet may operate below potential for an entire month before the data arrives and action is taken.
Staff Scheduling Is Optimised for Actual Demand
Real-time transaction data by hour and day allows retail chain owners to identify exactly when each outlet needs more staff and when it needs fewer. Scheduling decisions based on this data reduce labour cost on slow periods and improve service quality on peak periods simultaneously.
Vendor Negotiations Are Supported by Data
When purchase data is automatically tracked and compared against standard costs, vendor price variances are identified as they occur rather than discovered in a monthly audit. The owner walks into a vendor negotiation meeting with current data showing exactly which invoices deviated from contracted pricing and by how much. This data-backed negotiation position consistently produces better outcomes than negotiation based on general impressions.
10. What to Look for in a Retail Management System for Reporting
Not all retail management systems deliver the same reporting capability. Here is a practical evaluation framework for retail chain owners assessing a system’s reporting depth:
Real-Time Data Availability
Ask the vendor whether the reporting dashboard reflects transactions processed in the last five minutes or the last 24 hours. A system that updates reports daily is significantly less valuable than one that updates in real time. For operational decisions, the difference between today’s data and yesterday’s data is the difference between proactive management and reactive management.
Consolidated Multi-Outlet View
Ask to see a consolidated report covering multiple outlets simultaneously in the demo. If the system requires the user to run separate reports for each outlet and then manually combine them, the reporting architecture is not genuinely unified. A truly consolidated system produces multi-outlet reports from a single query with no manual combination required.
Drill-Down Capability
A consolidated report that shows totals is useful. A report that allows the user to click on any number and drill down to the individual transactions behind it is far more valuable for investigation and decision-making. Ask the vendor to demonstrate how a revenue discrepancy would be traced back to its source transactions in the system.
Customisable Report Parameters
Different retail chain owners need different reporting configurations depending on their category, outlet structure, and management priorities. Ask whether reports can be configured for custom date ranges, specific outlet combinations, product category filters, and staff-level attribution without requiring IT support or vendor assistance.
Scheduled Report Delivery
Ask whether the system can automatically generate and deliver specific reports to specific team members on a scheduled basis. A system that sends the daily sales summary to the owner’s mobile at 10 PM every night without requiring any manual action is more likely to be used consistently than one that requires the owner to log in and run the report each time.
Reporting Capability | Basic POS System | Unified Retail ERP |
Real-time data updates | End of day batch | Within seconds of transaction |
Multi-outlet consolidated view | Manual combination required | Single query across all outlets |
Drill-down to transaction level | Not available | Full transaction audit trail |
Gross margin by product | Not available | Automatic from recipe cost linkage |
GST compliance summary | Manual calculation | Automatic from transaction data |
Staff productivity by outlet | Not available | Automatic from shift and billing data |
Custom date range reports | Limited | Full flexibility |
Scheduled automatic delivery | Not available | Configurable by report and recipient |
Mobile dashboard access | Not available | Full dashboard on mobile |
Historical trend comparison | Limited | Full year-on-year and period comparison |
11. What RetailPOS Delivers for Retail Chain Reporting in India
RetailPOS is built on a unified architecture that connects every outlet’s billing, inventory, purchasing, and customer data to a single central platform. For retail chain owners who are currently spending three days every month on manual reporting, the platform delivers the complete reporting transformation described throughout this guide.
For retail chains across India, RetailPOS provides:
- Real-time consolidated sales dashboard updated after every transaction across all outlets simultaneously
- Gross margin reporting by outlet, category, and product with recipe cost automatically linked to billing data
- Complete inventory movement report showing every stock entry, exit, transfer, and adjustment across all outlets in real time
- Purchase and vendor performance reporting with automatic price variance detection against standard costs
- GST compliance summary with GSTR-1 and GSTR-3B data prepared automatically from central billing records
- Staff productivity reporting with labour cost as a percentage of revenue tracked daily by outlet
- Customer and loyalty reporting with acquisition, retention, and campaign performance data from the central CRM
- Outlet versus outlet comparison reporting with any metric across any combination of outlets and time periods
- Drill-down capability from any consolidated figure to the individual transactions behind it
- Mobile dashboard with full reporting access for owners monitoring chain performance from anywhere
- Scheduled report delivery to configured recipients at configured times without manual intervention
- Multi-GSTIN reporting for chains operating across multiple states with separate compliance records per registration
For a retail chain with five outlets currently spending 40 person-hours per month on manual reporting, the transition to RetailPOS typically reduces the monthly reporting cycle to under three hours within the first month of go-live. The accounts team that was building reports is now reviewing them. The owner who was waiting for reports is now accessing them in real time. The management decisions that were three days behind the operation are now ahead of it.
Explore how RetailPOS reporting works for your specific chain structure by visiting our multi-store retail management page or reading our guide on best ERP software for retail chains in India. You can also see how this reporting capability connects to GST automation in our guide on GST return filing for retail chains in Hyderabad.
12. Conclusion
Three days of manual reporting every month is not a necessary cost of running a retail chain in India. It is the cost of running a retail chain on systems that were not designed for consolidated multi-outlet management.
The retail chain owners across India who have made the transition to unified management platforms are not working with better data than their competitors. They are working with the same data, but they are working with it in real time rather than three days late, accurately rather than approximately, and in three hours rather than three days.
The management decisions they make as a result are faster, better informed, and more likely to be correct. The team time they save is redirected to work that actually grows the business. And the competitive advantage of being three days ahead of the market in every operational decision they make compounds quietly but powerfully over months and years.
If your retail chain is currently spending three days every month building the report that should take three hours, the gap between where you are and where a unified management system can take you is smaller to bridge than you think and larger in its impact than you might expect.
Book a free demo with the RetailPOS team and see exactly what your chain’s monthly reporting looks like when every outlet’s data lives in one place.
13. Frequently Asked Question
The three-day cycle is a direct result of disconnected systems across outlets. When each outlet runs its own billing software without a central backend, producing a consolidated report requires manually collecting data from every outlet, cleaning and standardising it into a consistent format, combining it across all sources, reconciling discrepancies that appear during combination, and then building the actual analysis. Each of these steps takes time and is dependent on the previous step completing correctly. A single error or missing data source can add a full day to the cycle. A unified retail management system eliminates all of these steps by maintaining all outlet data in one central database from the moment each transaction occurs.
For a five-outlet retail chain in India processing typical transaction volumes, the monthly reporting cycle consumes between 39 and 56 person-hours across the store managers, accounts team, warehouse staff, and owner. At conservative salary levels for experienced retail management staff in India, this represents a significant direct monthly labour cost. The indirect cost, in the form of decisions made on three-day-old data, purchasing errors from outdated stock information, and management capacity consumed in report review rather than forward planning, is typically larger than the direct labour cost.
Yes. The benefits of unified reporting are proportionally significant even for two or three outlet chains. The manual data collection and consolidation exercise that produces a three-day reporting cycle does not scale linearly with outlet count. A two-outlet chain still spends significant time on monthly reporting if those two outlets run disconnected systems. A unified platform reduces this to hours regardless of outlet count and gives the owner real-time visibility that changes how they manage both locations every day of the month, not just when the monthly report finally arrives.
A POS system report shows sales data from the billing counter. A retail ERP report shows business data from every function of the operation. The POS report tells you what sold and how much was collected. The ERP report tells you what sold, at what margin, compared to what was purchased, with what stock remaining, generating what GST liability, served by which staff members, to which customer segments, with what loyalty impact, at what labour cost percentage, and with what vendor price variance. The difference between these two reporting depths is the difference between knowing your revenue and understanding your business.
For a retail chain with clean product master data and a standard outlet structure, the transition to automated reporting is typically functional within the first two weeks of system implementation. The first month-end after go-live usually produces a complete automated report that the accounts team can compare against their manual process to validate accuracy. Most retail chains achieve full confidence in the automated reporting within two monthly cycles, at which point the manual process can be discontinued entirely. The transition is significantly faster when the product master data is cleaned and standardised before the system goes live.
Yes. RetailPOS provides a complete mobile dashboard that gives retail chain owners full access to their chain's performance data from any device at any location. The mobile dashboard includes real-time consolidated revenue, outlet-wise comparison, stock alerts, cash reconciliation status, and GST compliance summary. Owners who travel frequently between cities or who manage chains across multiple locations find the mobile dashboard particularly valuable because it maintains complete operational visibility without requiring physical presence at any outlet or access to a desktop workstation.

 Book your demo
 Talk to our POS experts
- 📧 Email: salesenquiry@uniprotech.co.in
Run your store with confidence. Let technology handle the complexity.
Or WhatsApp our team directly – we respond within minutes.
Or call us at 95662 44611