
Powered by Unipro Tech
How Multi-Store Retailers in India Are Managing 10 Outlets From One Dashboard in 2026
A practical guide for retail chain owners managing multiple outlets across India who want complete operational visibility without being physically present at every location
The Question Every Growing Retail Chain Owner Asks
You have built something real. One outlet became two. Two became five. Five are becoming ten. The business is growing and that is genuinely good news.
But somewhere around outlet three or four, a specific problem appeared that nobody warned you about. The business grew but your ability to see it clearly did not grow with it. You are making decisions about a ten-outlet chain based on information that arrives through phone calls, end-of-day WhatsApp messages, and monthly accounts that are always at least three weeks behind reality.
You know what happened yesterday at your Koramangala outlet. You are less sure about Whitefield. You have not spoken to the Hebbal manager since Tuesday. You genuinely do not know, right now at this moment, which of your outlets has the most stock, which has the highest footfall, or which is running a pricing error that a customer will complain about before the day is over.
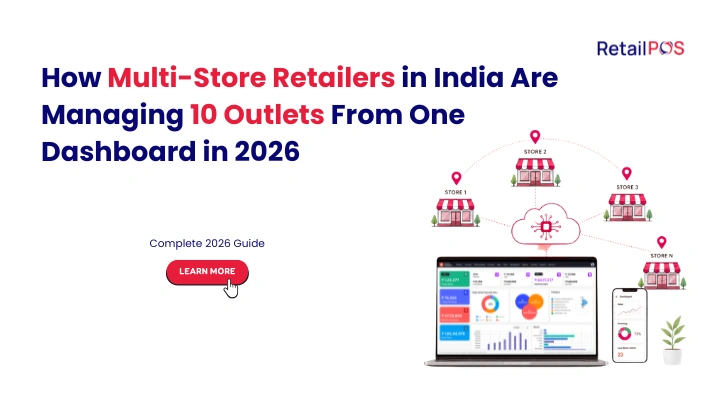
This is the multi-outlet visibility problem. It is the most common operational challenge for growing Indian retail chains in 2026. And the retailers who have solved it have done it with one specific tool: a live, centralised management dashboard that shows every outlet’s performance simultaneously from one screen on any device.
This guide explains exactly how they do it, what the dashboard shows, what changes when you can see your entire chain in real time, and how to implement this capability for your own retail business.
Section 1: Why Multi-Outlet Retail Management Breaks Down Without a Dashboard
The operational model that works at one or two outlets is built around the owner’s personal presence. You are the quality control system. You are the pricing authority. You are the stock management process. You are the staff performance monitor. And you are good at all of these things because you are physically there.
As the chain grows, your personal presence is divided among an increasing number of locations. At three outlets, you can visit each one every two days. At seven outlets, you are visiting each one twice a week if you are lucky. At ten outlets, some locations may see you only once a week, and the decisions that used to be made by your direct observation are now being made by outlet managers who have different information, different priorities, and different risk tolerances than you.
The result is predictable and universal across Indian retail chains of this size. Pricing inconsistencies emerge. Stock imbalances develop invisibly. Staff performance varies dramatically between outlets you visit frequently and those you visit rarely. Festival promotions activate at some outlets and not others. A stock error that would take you thirty seconds to spot and correct when you are on the floor takes days to surface through the reporting chain.
Infrastructure bottlenecks, particularly in logistics and supply chain management, pose operational challenges for retailers at scale. But the most damaging bottleneck for most Indian retail chains is not logistics. It is information. Specifically, the delay between something happening at an outlet and the chain owner finding out about it. IMARC
A live multi-outlet dashboard eliminates this delay. Every event at every outlet — every sale, every stockout alert, every pricing inconsistency, every staff performance metric — is visible to the chain owner the moment it happens, on a phone or laptop, from anywhere in the country.
Section 2: What a Centralised Retail Dashboard Actually Shows
A centralised retail management dashboard for a multi-outlet chain is not a report. A report shows you what happened. A dashboard shows you what is happening right now.
Here is what a live retail dashboard shows for every outlet simultaneously:
Sales Performance:
Metric | What It Shows | Why It Matters |
Today’s sales vs yesterday | Outlet-by-outlet comparison in real time | Identifies which outlets are having a good or bad day before the day ends |
Today’s sales vs same day last week | Week-on-week trend per outlet | Catches emerging performance problems early |
Today’s sales vs target | Achievement rate per outlet | Enables intraday intervention on underperforming outlets |
Average transaction value | Per outlet and per staff member | Identifies upselling effectiveness and basket size trends |
Transactions per hour | Per outlet, current day | Shows peak hour patterns and counter staffing efficiency |
Inventory Position:
Metric | What It Shows | Why It Matters |
Low-stock alerts | Products below minimum at any outlet | Enables reorder or inter-branch transfer before stockout |
Dead stock by outlet | Slow-moving products per location | Enables markdown or transfer before season end |
Stock value per outlet | Total inventory value at each location | Shows capital distribution across the chain |
Pending transfers | Inter-branch transfers in progress | Ensures transfers are completed and stock is updated |
Operational Metrics:
Metric | What It Shows | Why It Matters |
GST position | Current period compliance across all outlets | Early warning of any filing issue |
Staff performance | Sales per staff member per outlet | Identifies top performers and underperformers across the chain |
Promotion compliance | Whether all active offers are running at all outlets | Prevents pricing inconsistency reaching customers |
Section 3: The Seven Operational Problems That Disappear When You Have Complete Visibility
3.1 Pricing Inconsistencies That Customers Discover Before You Do
Without a centralised dashboard, a pricing error at one outlet surfaces when a customer complains or when a competitor notices and posts about it on social media. With a dashboard, the moment a price is entered incorrectly at any outlet, it is visible as a variance against the centrally configured price and can be corrected before a single customer is affected.
3.2 Stock Imbalances That Create Simultaneous Overstock and Stockout
The classic multi-outlet inventory failure: your Jubilee Hills outlet has 40 units of a style that is not moving while your Kukatpally outlet ran out of the same style a week ago. Neither manager knows the other’s position. No transfer happens. Both problems accumulate until a physical count reveals the waste that a real-time dashboard would have surfaced within hours.
With a centralised dashboard, the stock imbalance between two outlets is visible the moment it develops. A transfer can be initiated within the system that day, turning a dead-stock problem and a lost-sale problem into a profitable reallocation that serves customers and protects margin.
3.3 Promotions That Go Live at Some Outlets but Not Others
A festival promotion configured for all outlets should reach all counters simultaneously. Without centralised management, each outlet’s manager must manually implement the promotion in their local system. Some will do it promptly. Some will forget. Some will misunderstand the terms. Customers who visit multiple outlets will notice the inconsistency and the brand trust damage is real.
A centralised dashboard with push-based promotion management sends every offer from head office to every outlet at the configured time, automatically, without any action required from outlet managers.
3.4 Staff Performance That Varies Without Explanation
Your Indiranagar outlet consistently achieves a higher average transaction value than your Koramangala outlet even when footfall is similar. Without performance data per staff member, this difference is invisible and unmanageable. With a dashboard tracking sales per staff member at every outlet, the difference is visible and the cause is identifiable: a high-performing staff member at Indiranagar who is consistently upselling, whose behaviour can be studied and replicated across the chain.
3.5 GST Compliance Issues That Surface at Filing Time
A missing HSN code on a product category at one outlet creates a compliance gap in that outlet’s GSTR-1. Without consolidated compliance visibility, this gap is discovered when the monthly filing is prepared — after weeks of incorrect invoicing. With a dashboard showing compliance status across all outlets in real time, any configuration error is identified and corrected immediately.
3.6 Underperforming Outlets That Nobody Is Addressing
When management visibility requires physical presence, the outlets the owner visits least frequently receive the least management attention. These are often the outlets that need the most attention precisely because performance problems accumulate there unobserved. A dashboard equalises visibility: the outlet in the furthest suburb receives exactly the same management scrutiny as the outlet next to head office because both appear on the same live screen.
3.7 Working Capital Invisible Across the Chain
A retail chain owner who does not know the real-time inventory value at each outlet cannot make informed decisions about where to deploy purchasing capital. An outlet that is already overstocked continues to receive stock allocations because nobody can see the overstock in real time. An outlet that needs urgent replenishment waits for the next scheduled delivery because the urgency is not visible from head office. A dashboard showing stock value at every outlet enables capital allocation decisions based on current reality.
Section 4: How Indian Retail Chains Are Using Dashboard Data to Make Better Decisions
The retail chains that are growing profitably in India in 2026 are using their management dashboards actively, not just as a monitoring tool but as a daily decision-making system.
Decision 1: Morning priority setting.
Every morning the chain owner opens the dashboard and sees yesterday’s performance across all outlets ranked from best to worst. Outlets that underperformed yesterday get a specific management intervention today — a call to the manager, a visit if the gap is significant, or a specific promotional action. This takes ten minutes with a dashboard. It is impossible without one.
Decision 2: Intraday stock response.
When a low-stock alert fires at a specific outlet during the day, the chain owner or operations manager sees the alert on the dashboard immediately. They check whether another outlet has surplus of the same product. If it does, an inter-outlet transfer is initiated within the system. The receiving outlet has additional stock before the next day’s trading. Without the dashboard, this alert either does not exist or arrives as a phone call from the outlet manager when the stockout has already happened.
Decision 3: Weekly buying decisions.
At the end of each week, the dashboard’s slow-mover and fast-mover reports show exactly which products are performing at each outlet. The next purchase order is allocated to outlets based on this week’s actual consumption data rather than last month’s average or the purchasing manager’s estimate. Over-ordering for outlets that do not need the stock stops. Under-ordering for outlets that are running fast on specific products stops.
Decision 4: Staff performance intervention.
Monthly staff performance data from the dashboard identifies which outlets have a performance gap and whether that gap is in transaction volume, average bill value, or both. The intervention, whether additional training, incentive structure change, or staffing adjustment, is targeted and specific because the data is specific.
Section 5: What Changes in Your Daily Routine When You Have a Live Dashboard
Before implementing a multi-outlet dashboard, the typical Indian retail chain owner’s daily routine includes:
- 6 to 8 phone calls to outlet managers every morning
- WhatsApp messages to check stock positions throughout the day
- An hour of report compilation at the end of each week
- Three days of account reconciliation at month end
- A GST filing process that takes two to four days because data must be extracted from each outlet separately
After implementing a live centralised dashboard, the same chain owner’s daily routine looks like this:
- 10 minutes reviewing the dashboard over morning coffee showing all outlets’ yesterday performance
- Dashboard alerts for any stock, pricing, or compliance issue throughout the day
- One-click weekly reports generated automatically from live data
- Month-end accounts completed in a fraction of the previous time because all data is already centralised
- GST filing completed in under two hours from consolidated transaction data
The time saving alone, conservatively 15 to 20 hours per week for a ten-outlet chain, is significant. But the bigger value is decision quality. Every decision made from real-time data is a better decision than the same decision made from information that is three days old.
Section 6: The Technical Foundation: What Makes Real-Time Multi-Outlet Visibility Possible
Real-time multi-outlet visibility is only possible when all outlets share one centralised database. This is the architectural difference between a genuine multi-outlet retail management system and a collection of single-outlet billing applications that each maintain their own local data.
How it works:
Every billing transaction at every outlet writes to the same centralised cloud database the moment it is processed. The dashboard reads from this same database. The result is that any sale processed at any outlet appears on the dashboard in real time without any manual data transfer, any end-of-day sync, or any reporting step.
The offline requirement:
For Indian retail operations, the centralised database architecture must be combined with full offline billing capability at every outlet. When internet connectivity is interrupted, each outlet must continue billing locally at full speed and synchronise to the central database automatically when connectivity is restored. The dashboard will show a brief lag for that outlet during the connectivity gap, but no transaction data is lost and operations are never interrupted.
The mobile requirement:
A dashboard that can only be accessed from a desktop computer in the head office is not a mobile business management tool. The centralised dashboard must be accessible from any device, specifically a smartphone, because the retail chain owner who is visiting one outlet needs visibility into all other outlets from their phone in real time.
Section 7: How RetailPOS Cockpit Delivers Multi-Outlet Management for Indian Retail Chains
RetailPOS Cockpit is the live multi-outlet management dashboard built specifically for Indian retail chains. It connects every outlet in the chain through RetailPOS Enterprise’s centralised database and presents a real-time view of the entire chain’s performance on one screen accessible from any device.
What Cockpit shows for every outlet simultaneously:
- Live sales for the current day versus yesterday and versus the same day last week
- Current inventory levels with low-stock alerts highlighted
- Active promotions and whether they are correctly configured at every outlet
- Staff performance metrics per outlet and per individual staff member
- GST position and compliance status for the current period
- Pending inter-outlet transfers and their completion status
- Top-selling and slow-moving products across the chain
What Cockpit enables beyond visibility:
Cockpit is not a read-only reporting tool. From within the dashboard, the chain owner or head office team can initiate pricing changes that push to all outlets instantly, create inter-outlet transfer requests that appear in both the sending and receiving outlet’s system simultaneously, and generate GST reports for any outlet or the entire chain with one click.
Cockpit for different retail formats:
Retail Format | Key Cockpit Metric | Primary Action Enabled |
Supermarket chain | Stock levels at every outlet by category | Inter-outlet transfer of fast-moving produce before stockout |
Apparel chain | Variant-level slow-mover by outlet | Size reallocation from overstocked outlet to stockedout outlet |
Electronics chain | High-value item inventory per outlet | Reallocation of specific models based on demand pattern |
Pharmacy chain | Near-expiry alerts across all outlets | Proactive transfer or markdown before expiry |
Multi-format chain | Cross-category performance by outlet | Identify best-performing outlet by format for replication |
Cockpit on mobile:
The Cockpit dashboard is fully functional on a mobile phone. A retail chain owner driving between their Anna Nagar outlet and their Velachery outlet can see both outlets’ live performance, any alerts that fired in the last hour, and the current stock position at the outlet they are heading to before they arrive. They walk into the store already knowing what needs attention rather than spending the first twenty minutes of every visit asking questions.
Conclusion: Your Retail Chain Is Already Generating the Data. You Just Cannot See It Yet.
Every transaction at every outlet in your retail chain is generating valuable operational data right now. Sales data. Inventory data. Staff performance data. Compliance data. Customer data. All of it exists. The question is whether you can see it in real time or whether it arrives days late in a compiled report that takes someone hours to prepare.
The Indian retail chains that are scaling efficiently in 2026 are not doing something fundamentally different from the chains that are struggling. They are selling the same products to the same customers in the same markets. The difference is that they can see their entire operation clearly, in real time, from one screen. And that visibility enables them to make faster decisions, catch problems earlier, allocate resources more intelligently, and respond to opportunities before they close.
You have built a ten-outlet chain. You deserve to be able to manage it from one dashboard.
Frequently Asked Questions
RetailPOS Cockpit is designed to manage retail chains from 2 outlets to 200 or more outlets from the same platform. The dashboard scales with the chain — adding a new outlet to the system typically takes two to five days, and the new outlet appears on the Cockpit dashboard automatically from the moment it goes live. There is no upper limit on outlet count that changes the fundamental capability of the dashboard.
Cockpit shows real-time data from every outlet. Every transaction processed at any outlet updates the centralised database immediately, and the dashboard reflects this update within seconds. The only exception is when an outlet is operating in offline mode due to connectivity interruption, in which case that outlet's data updates when connectivity is restored and synchronisation completes. All other outlets' data remains real-time throughout.
Yes. Pricing changes and promotional configurations made from head office through the RetailPOS system push to all selected outlets simultaneously. The Cockpit dashboard shows whether each outlet has the current pricing and promotions correctly configured, flagging any discrepancy immediately. Festival promotions configured in advance activate at the exact configured time at every outlet without any action required from individual outlet managers.
Cockpit is fully functional on any device including smartphones, tablets, laptops, and desktop computers. The mobile interface is designed for a chain owner who is visiting outlets or travelling and needs complete visibility into all other outlets from their phone. All key metrics, alerts, and management actions available on the desktop version are accessible on mobile.
The Cockpit dashboard shows the current GST compliance status for every outlet including any configuration gaps, missing HSN codes, or filing status issues. Because all outlet transaction data flows into one centralised database, GSTR-1 and GSTR-3B reports for any outlet or for the entire chain can be generated with one click from the management interface. This eliminates the multi-day manual compilation process that multi-outlet chains without centralised systems experience every month.
Both depend on the same underlying need: rules set once at head office, applied identically everywhere. If point accumulation or redemption rules differ between outlets, even accidentally, customers experience it as the same kind of trust erosion that inconsistent pricing causes.
About RetailPOS
RetailPOS is an enterprise retail POS and ERP solution by Unipro Tech Solutions Pvt Ltd, headquartered in Chennai, Tamil Nadu. With over 20 years of experience and 10,000 plus businesses served across India and globally, RetailPOS provides purpose-built multi-outlet retail management including the Cockpit live dashboard for retail chains across every format and category.

Book a free demo and see how RetailPOS gives you complete financial visibility across your operations..
Or WhatsApp our team directly – we respond within minutes.
Or call us at 95662 44611