Powered by Unipro Tech
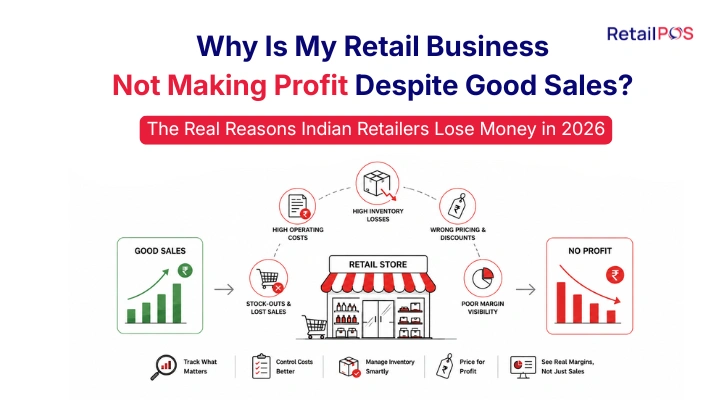
Why Is My Retail Business Not Making Profit Despite Good Sales? The Real Reasons Indian Retailers Lose Money in 2026
1. Introduction
You look at your revenue figures at the end of the month and they look reasonable. Your store was busy. Your staff were working. The billing counter never stopped. Customers kept coming. On the surface, everything looks like a successful retail business.
Then you look at what is actually left after paying your suppliers, your staff, your rent, your GST, your utilities, and every other cost, and the number is smaller than it should be. Sometimes it is uncomfortably small. Sometimes it is barely positive. And the frustrating part is that you cannot quite point to where the gap is coming from because nothing obvious has gone wrong.
This is the most common and least discussed problem in Indian retail. Not the businesses that are visibly failing, but the ones that are doing “fine” by most appearances while quietly leaving significant profit on the table every single month without knowing exactly where it is going.
This guide is written specifically for Indian retail business owners who have decent sales but disappointing profit. It names every specific place the money is leaking, puts real rupee figures on each leak for a typical Indian retail business, and explains exactly what needs to change to close the gap between your revenue and your actual profit.
2. The Good Sales Low Profit Paradox in Indian Retail
Before getting into specific reasons, it is worth understanding why good sales and low profit can coexist in the first place, because this combination feels contradictory until you understand the mechanics.
Revenue is the total money your customers give you. Profit is what is left after every cost is subtracted. The gap between the two is not just your visible costs like rent and staff salaries. It is also the invisible costs that never appear on any invoice but leave the business every day through inefficiency, inaccuracy, and undetected leakage.
Most Indian retail businesses have excellent visibility into their revenue and reasonable visibility into their largest explicit costs. What they have almost no visibility into is the layer of costs that exist in the gap between what should be happening and what is actually happening in their operation every day.
A product that should cost Rs 100 to sell is actually costing Rs 115 because portion quantities are higher than the standard, or because wastage is higher than budgeted, or because a supplier price increase was absorbed without a corresponding price adjustment.
Staff working hours billed are higher than the hours generating revenue because scheduling has not been aligned with actual demand patterns.
Customers who were visiting twice a month are now visiting once because nobody detected the change in their behaviour and reached out before they drifted further.
Each of these gaps is small individually. Collectively, across every product, every staff member, every customer, and every transaction in a busy retail operation, they create the difference between a business that generates good revenue and one that also generates good profit.
3. Reason One: Your Cost of Goods Is Higher Than You Think
This is the most common silent profit killer in Indian retail and the one that most retail owners underestimate because the billing system shows the sale price but rarely shows the true cost of what was sold after accounting for all the factors that drive that cost higher than the purchase invoice suggests.
Supplier Price Drift
Your supplier has been delivering goods at a certain price for months or years. At some point the price increases. The delivery arrives, the higher price gets paid, and the invoice enters the accounts. But nobody updates the standard cost in the billing or inventory system to reflect the new price. Your selling price stays the same. Your cost has gone up. The margin on every unit sold has silently reduced, and no report in your business reflects this because there is no system comparing what you expected to pay against what you actually paid for each product category.
For a supermarket in Hyderabad buying across dozens of suppliers, even a 3% average supplier price drift that goes unmatched by selling price adjustments represents a significant erosion in gross margin every month.
Quantity and Quality Variance on Inward Goods
Goods received from suppliers do not always match the quantity on the invoice. A delivery of 100 units where 94 arrive and 6 are damaged represents a cost of 100 units billed against revenue from 94 units sold. Without a system that logs received quantity separately from invoiced quantity and flags variances, this discrepancy either goes undetected or is absorbed informally without any record.
Untracked Wastage and Write-Offs
For any retail business handling perishables, or any business where products expire, get damaged, or are consumed internally, the cost of these units needs to be tracked explicitly. When they are absorbed informally, the cost shows up in the accounts but the corresponding reduction in inventory and margin does not, creating a picture that makes profitability appear better than it is until the next stock count reveals the true position.
What to Do About It
Compare your actual purchase invoices against your standard product costs at least monthly. Set up a system that tracks received quantity against invoiced quantity and flags variances above a threshold. Record every write-off and wastage event formally rather than informally.
4. Reason Two: Inventory Shrinkage Is Silently Eating Your Margin
Inventory shrinkage is the gap between what your system shows as available stock and what is physically on your shelves. In a retail business without real-time inventory tracking across every movement type, this gap grows continuously and silently.
The industry benchmark for Indian retail chains without centralised inventory tracking is shrinkage of between 1.5% and 3.5% of annual inventory value. For a mid-size retail chain with Rs 50 lakh in monthly revenue and a cost of goods around Rs 33 lakh per month, shrinkage at the midpoint of 2.5% represents Rs 9.9 lakh per year leaving the business without any record.
The reason shrinkage feels invisible is that it does not create a visible cost entry. There is no invoice for it. There is no salary line for it. It simply appears as a stock count gap once a month or quarter, gets quietly written off, and the cause goes uninvestigated because too much time has passed since whatever created the discrepancy.
Shrinkage in retail businesses comes from multiple sources simultaneously: undocumented inter-outlet transfers, receiving errors where delivered quantities are not verified against purchase orders, billing errors where the transaction records a different quantity than was actually sold, and in some cases deliberate removal of goods by staff who know the inventory system only updates at the billing counter.
A system that tracks every movement, not just sales, and that automatically compares actual consumption against theoretical consumption based on sales data will identify variances within days rather than months, making the cause traceable and correctable rather than absorbed as an unavoidable business cost.
5. Reason Three: Your Staff Cost Is Growing Faster Than Your Revenue
Staff cost is typically the second largest expense in a retail business after cost of goods, and it is one of the expenses that grows most invisibly when it is not tracked with the same precision as other costs.
The most common pattern is that staff scheduling is established based on historical demand patterns and then maintained by inertia long after the demand patterns have changed. A schedule set up when the business was doing 300 transactions per day on Saturday mornings continues unchanged even when Saturday morning volume has shifted to Saturday evenings due to changes in customer behaviour. The business overstaffs Saturday mornings and understaffs Saturday evenings simultaneously, losing margin on both ends.
Overtime is the other invisible driver of staff cost growth. In retail businesses without precise shift tracking, staff who regularly work beyond their contracted hours accumulate overtime pay that compounds across a full team over twelve months into a meaningful additional cost. Without a system that tracks shift end times and automatically calculates overtime against contracted hours, this cost only becomes visible on payroll and is never broken down to show which outlet, which day, and which role is driving it.
The fix is not to cut staff. It is to align staffing levels with actual transaction demand data, which requires a system that tracks both. When you can see labour cost as a percentage of revenue at each outlet by day of week and time of day, scheduling decisions become data-driven rather than inertia-driven, and the same revenue is typically achievable with a meaningfully lower labour cost percentage.
6. Reason Four: You Are Losing Customers Without Knowing It
Customer churn is one of the largest invisible profit leaks in Indian retail because it does not create a visible event. A regular customer who stops visiting does not send a cancellation notice. They simply stop appearing, and in a business without customer identity data linked to transactions, their absence goes completely undetected.
Industry analysis of Indian retail chains consistently shows annual churn rates of 20% to 30% for businesses without active retention systems. For a pharmacy chain in Kochi with 600 regular customers spending Rs 1,200 per month each, a 25% annual churn rate represents 150 customers per year who stop visiting. At Rs 14,400 annual revenue per customer, this is Rs 21.6 lakh in annual revenue disappearing invisibly through the exit of customers who were never prompted to return.
The compounding nature of this problem is what makes it particularly damaging for profitability. You acquired each of these customers at some cost, through location, word of mouth, or marketing. Their departure means that acquisition cost generated only a portion of its potential lifetime return before the relationship ended undetected.
A CRM system that captures customer identity through mobile number registration at billing and tracks visit frequency creates the mechanism to detect when a regular customer has gone silent. An automated re-engagement message via WhatsApp, sent when visit recency exceeds the customer’s normal pattern, recovers 30% to 40% of at-risk customers before they fully drift, turning what was previously an invisible annual loss into a managed retention programme.
7. Reason Five: Your Purchase Decisions Are Costing You Working Capital
Working capital locked in slow-moving inventory is one of the most significant and least recognised profit leaks in Indian retail. It does not create a loss in the traditional accounting sense, but it represents capital that is not available for the productive activities, additional stock of fast-moving items, supplier negotiations requiring early payment, or growth investments, that would generate returns.
The pattern is consistent across retail categories. A buying decision is made based on last month’s sales data or a supplier’s recommendation. The order is placed. The stock arrives and begins selling. Part of the order, typically the size range or product variant that was overestimated relative to demand, sells slowly and eventually requires a markdown or write-off to clear. Meanwhile, a different product or variant that was underestimated runs out during peak demand and loses sales.
The root cause in both directions is the same: purchase decisions made on aggregate or historical data rather than current, product-specific, outlet-specific velocity data. When you know in real time that your Bengaluru outlet is selling a particular size twice as fast as your Chennai outlet, your next purchase order for that product reflects this difference. When you do not have this data, both outlets get the same quantity allocation based on average demand, and both end up either overstocked or understocked relative to their actual need.
8. Reason Six: GST Errors Are Creating Hidden Liabilities
This is a profit leak that most retail owners do not think about until it becomes a compliance notice, by which point the interest and penalties have already accumulated.
GST errors in retail businesses typically occur in three ways. The first is incorrect rates applied to products because HSN codes were set up incorrectly when the product was first entered into the system. The second is incorrect categorisation of B2B transactions as B2C when the buyer’s GSTIN was not captured at billing, preventing the buyer from claiming ITC and creating a relationship risk. The third is ITC claimed on supplier invoices that the supplier did not file correctly, creating a GSTR-2B mismatch that the GST portal will flag during reconciliation.
None of these errors generate an immediate alert. They accumulate silently across hundreds or thousands of transactions and surface either during annual return preparation, when GSTR-9 reconciliation reveals discrepancies, or as a scrutiny notice from the GST department. By that point, interest at 18% per annum has been accruing from the original due date and the correction requires amendment filings that add to the accounts team’s workload.
For a retail business with Rs 60 lakh in monthly revenue, even a 1% error rate on filed GST values creates an exposure of Rs 60,000 per month in potential interest and correction costs. Automated HSN mapping and return preparation that eliminates operator error at the transaction level prevents this entire category of cost from accumulating.
9. Reason Seven: Your Pricing Strategy Has Holes You Cannot See
Pricing inconsistency is a profit leak that is particularly common in multi-outlet retail chains but also affects single-outlet businesses that run frequent promotions, discounts, or negotiated prices for specific customers.
The most common version is a festival promotion that was not executed identically across all outlets. One outlet applied the correct discount level. Another applied a deeper discount because the manager misread the briefing. A third continued the promotional pricing for three days after the promotion ended because nobody remembered to manually deactivate it in the billing system.
The combined margin impact of these execution inconsistencies across every promotional period in a year is typically larger than most retail owners realise because it never appears as a single line item. It is distributed across thousands of individual transactions where the price was slightly wrong, and it only becomes visible when someone specifically analyses actual transaction prices against intended prices, which almost never happens in businesses without the data infrastructure to support that analysis.
Even in a single-outlet business without promotional pricing, incorrect discounts applied by cashiers, whether through error or through relationships with specific customers, create a consistent margin leak that is invisible without cashier-level transaction analysis.
10 . The Profit Diagnostic: Where Is Your Money Actually Going
Use this diagnostic framework to estimate which profit leaks are most significant for your specific business. Rate each from 1 to 5 based on how likely it is to be affecting your business right now, with 5 being very likely.
Profit Leak | Your Rating 1 to 5 | Monthly Impact Estimate |
Cost of goods higher than standard due to supplier drift | Rs 50,000 to Rs 3 lakh | |
Inventory shrinkage above industry average | Rs 50,000 to Rs 2 lakh | |
Staff cost as percentage of revenue is not optimised | Rs 30,000 to Rs 1.5 lakh | |
Customer churn going undetected and unaddressed | Rs 50,000 to Rs 3 lakh | |
Working capital locked in slow-moving inventory | Rs 30,000 to Rs 1 lakh | |
GST errors creating interest and penalty exposure | Rs 10,000 to Rs 50,000 | |
Pricing errors and promotion inconsistencies | Rs 20,000 to Rs 1 lakh |
Add up your estimated monthly impact for every item you rated 3 or above. This total represents the profit recovery opportunity that better systems and processes can address for your specific business. For a mid-size retail chain with multiple outlets, this total commonly falls between Rs 3 lakh and Rs 8 lakh per month, meaning the business is generating that much less profit per month than it could with the same revenue.
11. How Technology Fixes Each Profit Leak
Profit Leak | What Technology Does |
Cost of goods higher than standard | Supplier price tracking with automatic variance alerts when invoice price deviates from standard cost |
Inventory shrinkage | Real-time tracking at every movement point with actual versus theoretical consumption comparison |
Staff cost optimisation | Labour cost as percentage of revenue tracked daily by outlet with scheduling linked to demand data |
Customer churn | CRM-linked loyalty with visit frequency tracking and automated re-engagement campaigns |
Working capital locked in slow stock | Real-time sales velocity data driving variant-level purchase planning and automated reorder |
GST errors | Automated HSN mapping, return preparation, and ITC reconciliation eliminating operator errors |
Pricing inconsistencies | Centralised promotion management with automatic activation and cashier-level discount tracking |
The common thread across every one of these solutions is visibility. Every profit leak in this guide exists because the business cannot currently see it happening. The technology solution in every case is not a complex intervention. It is the creation of the visibility that allows the problem to be detected and addressed before it compounds.
12. Worked Example: A Retail Chain Recovering Rs 8 Lakh Per Year
Consider a three-outlet apparel chain in Bengaluru with combined monthly revenue of Rs 35 lakh. The owner knows the business is profitable but feels the margin should be higher given the sales volume.
After implementing unified retail chain management software, the business identifies and addresses the following within the first year:
Supplier price variance alerts identify three product categories where prices had drifted above standard without corresponding selling price adjustments. Correcting these generates an average margin improvement of 1.2% across those categories, worth approximately Rs 1.8 lakh annually.
Real-time inventory tracking identifies shrinkage concentrated at one specific outlet in the receiving process. Improving the goods receipt documentation at that outlet reduces shrinkage by 55% at that location, saving approximately Rs 1.2 lakh annually.
CRM implementation identifies 180 customers who were regular visitors but had not appeared in the last 30 or more days. Re-engagement campaigns recover 62 of these customers, generating approximately Rs 1.5 lakh in recovered annual revenue.
Cashier-level discount tracking identifies two staff members applying discounts at significantly above the chain average without authorisation. Addressing this behaviour reduces average transaction discount rate across the chain, improving margin by approximately Rs 90,000 annually.
Centralised promotion management for three festival promotion periods eliminates the pricing inconsistencies that previously cost approximately Rs 60,000 in unintended deep discounting annually.
Variant-level purchase planning for the next buying season reduces slow-moving inventory at season end, freeing approximately Rs 2.5 lakh in working capital that would otherwise have been marked down.
Total identifiable annual benefit: Rs 8,55,000
The subscription and implementation cost for a three-outlet chain for the year: approximately Rs 2,50,000 including hardware.
Net annual benefit after technology investment: Rs 6,05,000
13. What RetailPOS Delivers for Retail Profitability
RetailPOS is built specifically to give Indian retail chain owners visibility into every one of the profit leaks described in this guide.
For cost of goods accuracy, RetailPOS tracks purchase invoices against standard product costs and flags variances automatically.
For inventory shrinkage, the platform tracks every movement at every outlet with actual versus theoretical consumption variance alerts updated daily.
For staff cost optimisation, labour cost as a percentage of revenue is tracked per outlet per day with shift-level attendance and overtime visibility.
For customer retention, the integrated CRM captures customer identity through mobile number registration, tracks visit frequency, and triggers automated WhatsApp re-engagement when churn risk is detected.
For purchase planning, real-time sales velocity data drives variant-level reorder alerts and purchase order generation before stockouts occur.
For GST compliance, automated HSN mapping, return preparation, and ITC reconciliation eliminate the operator errors that create hidden GST liabilities.
For pricing accuracy, centralised promotion management and cashier-level discount tracking close the gap between intended and actual transaction prices across every outlet.
Every feature RetailPOS delivers maps directly to one of the seven profit leaks in this guide, which means the platform is not adding management complexity. It is systematically closing the gaps where Indian retail businesses lose profit every day without knowing it.
Explore how RetailPOS recovers retail profitability for chains across India by visiting our multi-store retail management page or reading our guide on why retail chains lose revenue to operational blindspots. You can also see how the platform handles real-time inventory in our guide on how retail chains cut reporting from 3 days to 3 hours.
14. Conclusion
Good sales and low profit are not a contradiction in Indian retail. They are a predictable outcome when revenue is growing faster than operational visibility. Every one of the seven reasons in this guide is a specific, fixable, measurable profit leak. None of them require cutting prices, reducing headcount, or making dramatic business changes. All of them require creating the visibility that allows the problem to be detected and addressed before it compounds into another month of lower profit than your revenue deserves.
The retail business owners in India who are converting good sales into good profit are not doing anything fundamentally different in their operations. They are doing the same things with systems that show them what is actually happening across every outlet, every product, every customer, and every transaction, so that the gaps between what should be happening and what is actually happening close automatically rather than growing invisibly.
If your retail business is generating good sales but disappointing profit, the gap is real, it is measurable, and it is recoverable. Book a free demo with the RetailPOS team today and see exactly where your profit is going and what it looks like when those leaks are closed.
Frequently Asked Questions
The most common reasons are a combination of invisible profit leaks rather than a single visible problem. These include inventory shrinkage from untracked stock movements, cost of goods higher than standard due to supplier price drift, staff costs growing faster than revenue, customer churn going undetected without a CRM system, working capital locked in slow-moving inventory from purchase decisions made on outdated data, and GST errors creating interest and penalty exposure. Each of these leaks is individually small but collectively they often account for 10% to 20% of the gap between gross revenue and actual profit.
Healthy profit margins vary significantly by retail category. Supermarkets typically operate at 2% to 5% net margin. Pharmacy chains average 15% to 20% gross margin before operating expenses. Apparel and textile chains typically achieve 35% to 50% gross margin with net margins of 8% to 15% in well-managed operations. Electronics retail typically operates at lower gross margins of 10% to 20% with tighter net margins. If your net margin is consistently below these ranges despite normal trading, operational leakage rather than market conditions is usually the primary cause.
Start with the profit diagnostic framework in this guide, rating each of the seven profit leaks from 1 to 5 based on how likely each is to be affecting your business. Then get specific data for your top three rated leaks. For shrinkage, compare your last three physical stock counts against what the system predicted. For staff cost, calculate labour as a percentage of revenue by day of week and look for patterns. For customer churn, estimate how many customers who visited regularly three months ago have not appeared recently. These three data points usually reveal where the largest leaks are concentrated.
Yes, more so than most retail owners realise. Industry benchmarks for Indian retail chains without centralised inventory tracking show shrinkage rates between 1.5% and 3.5% of annual inventory value. For a chain with Rs 30 lakh in monthly inventory value, even the lower end of this range represents Rs 5.4 lakh per year in stock that leaves the business without a record or a corresponding revenue entry. The reason it feels less significant than it is comes from the fact that it never appears as a single invoice or salary line. It accumulates invisibly across hundreds of small events and only surfaces as a stock count gap that gets written off without investigation.
RetailPOS closes the visibility gap that allows each of the seven profit leaks to persist undetected. Real-time inventory tracking with variance alerts identifies shrinkage within days rather than months. Supplier price tracking flags cost increases before they erode margin invisibly. CRM-linked loyalty captures customer identity and detects churn before customers fully drift. Cashier-level discount tracking surfaces unauthorised pricing before it becomes a pattern. Centralised promotion management ensures intended pricing is executed consistently across every outlet. And automated GST compliance eliminates the interest and penalty exposure from filing errors. Together, these capabilities typically recover Rs 3 lakh to Rs 8 lakh per year in profit for a mid-size Indian retail chain, compared to a typical annual software investment of Rs 1.5 lakh to Rs 3 lakh.
The first step is to calculate your gross margin percentage for the past three months and compare it against your theoretical gross margin based on your standard product costs and pricing. If actual gross margin is consistently lower than theoretical margin, cost of goods and shrinkage are the primary areas to investigate first, as these typically represent the largest and most immediately recoverable profit leaks. If gross margin looks reasonable but net profit is still thin, the investigation moves to staff cost optimisation, customer retention, and operational inefficiencies. Completing the profit diagnostic in this guide before speaking to any technology vendor gives you the data to have a specific, informed conversation about which capabilities your business most urgently needs.

 Book your demo
 Talk to our POS experts
- 📧 Email: salesenquiry@uniprotech.co.in
Book a free demo and see how RetailPOS gives you complete financial visibility across your operations..
Or WhatsApp our team directly – we respond within minutes.
Or call us at 95662 44611